An iPhone companion for Intervals.icu

Your training, easy to read at a glance.

Finished a race? See how it went before your cooldown’s over. Soona turns your Intervals.icu data into clear, glanceable screens for fitness, form, power and PBs, right on your iPhone.

Free beta · iPhone · iOS 26 or later
An independent app. Not affiliated with or endorsed by Intervals.icu.

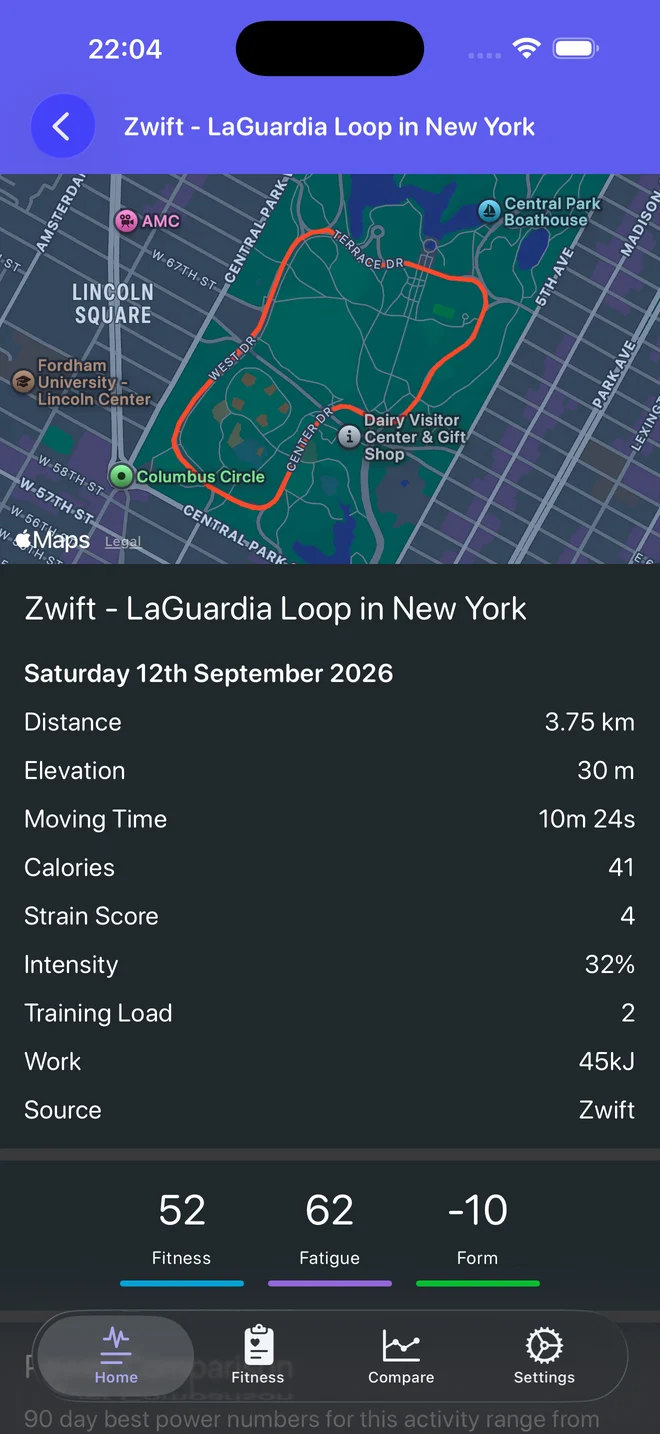
Soona Activity screen with a route map and ride metrics
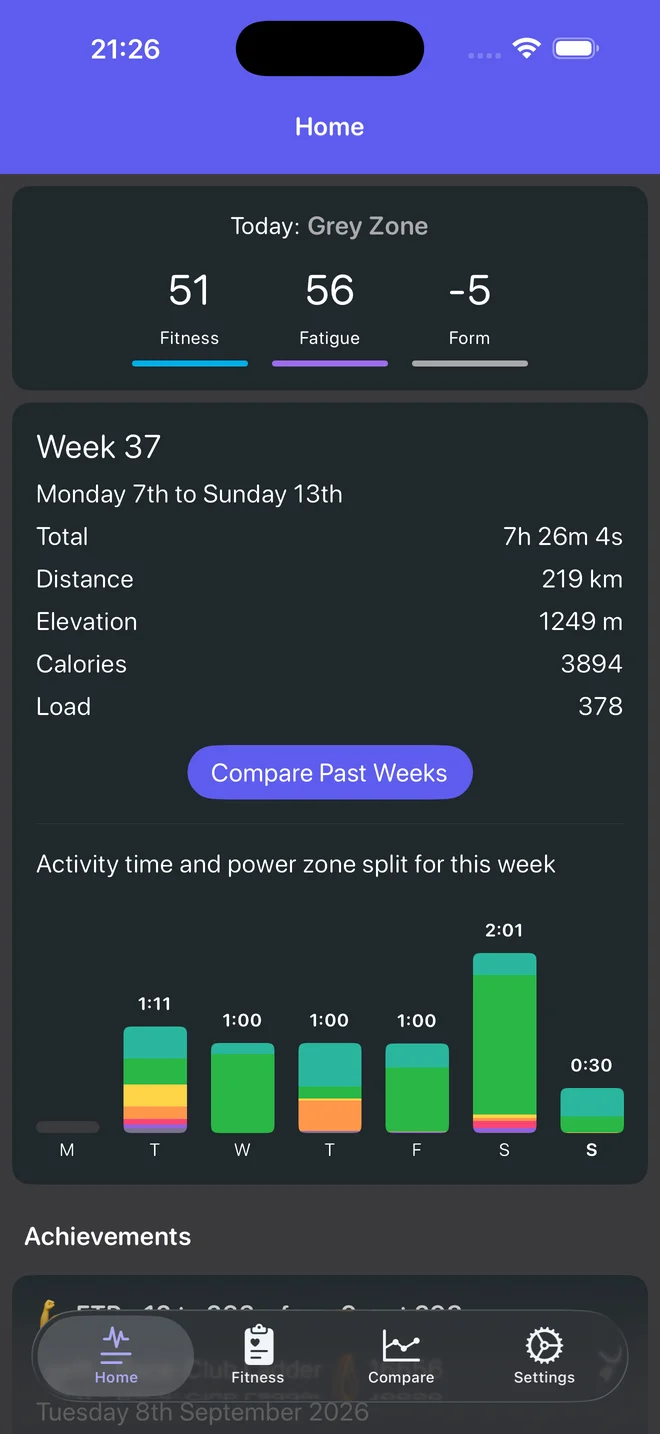
Soona Home screen showing fitness, fatigue, form and this week's totals

What Soona is

Native, focused, and deliberately narrow.

Intervals.icu already does the hard work. Soona shows the parts you check most, in a layout made for your phone.

Read only

It displays the data in your account. It never recomputes or invents values.

Honest by default

Every metric is shown with its reference point. No made up thresholds or benchmarks.

At a glance

The figures you check most are a tap away, designed for iPhone.

Cycling first

Built around cycling, with power at the centre, in a calm dark interface.

Privacy

It reads your account. Nothing more.

Soona talks directly to the Intervals.icu API using only your own credentials.

  • Your key stays on your phone. Your Intervals.icu API key and athlete ID are held in the iPhone’s secure Keychain.
  • No middleman. Your credentials never leave the app, except to call Intervals.icu directly.
  • Data stored on device. Activities and metrics are cached locally so the app opens fast.
  • Minimal analytics. Anonymous, EU hosted usage stats through TelemetryDeck. Nothing about your rides.
Platform
Native iOS, Swift and SwiftUI
Requires
iOS 26.0 or later, iPhone only
Interface
Dark mode only
Data
Intervals.icu API, stored on device
Sign in
API key today, OAuth coming
Analytics
TelemetryDeck, EU hosted

Home

Your week, your wins, your season.

Today’s fitness, fatigue and form, this week’s totals, and time in each power zone for every day. Notable moments are highlighted, like an FTP change or an all time power improvement, each tied to the ride that earned it. Below them sit your scheduled workouts, recent activities and a week by week view of your whole season.
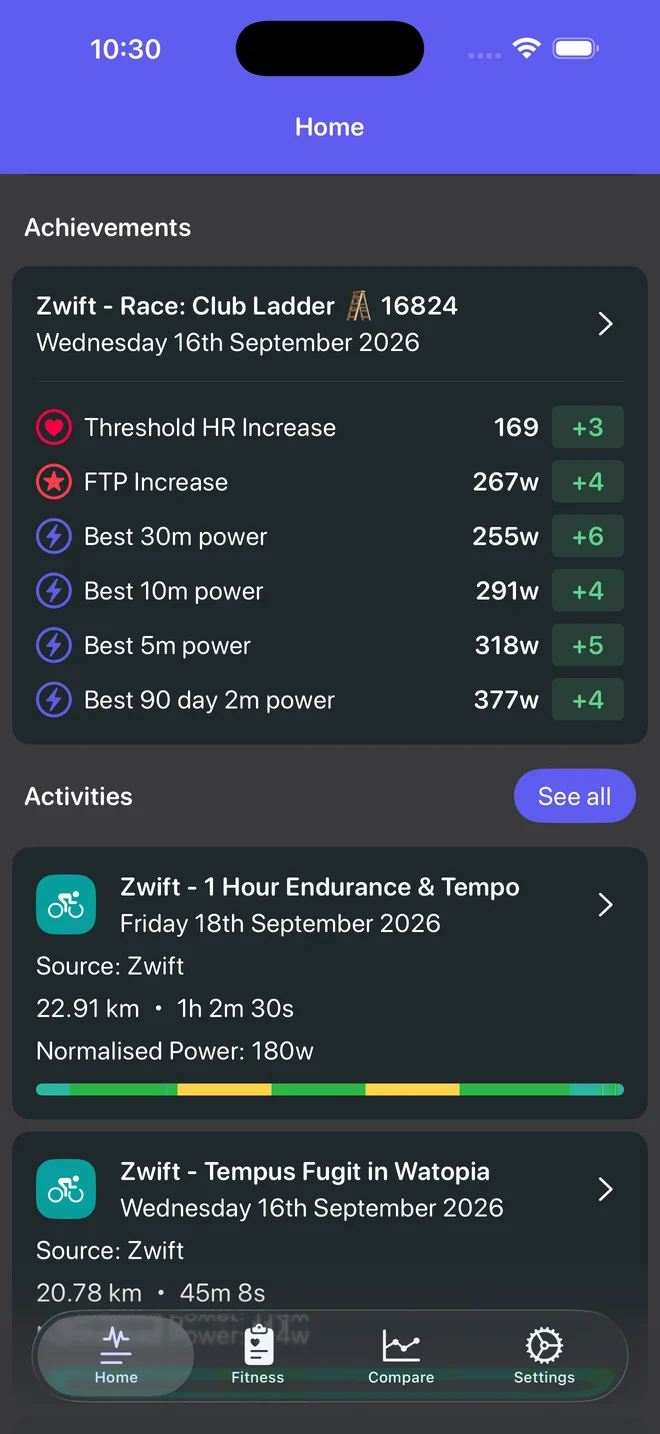
Achievements list showing FTP and best power increases

Fitness

Fitness and form over time.

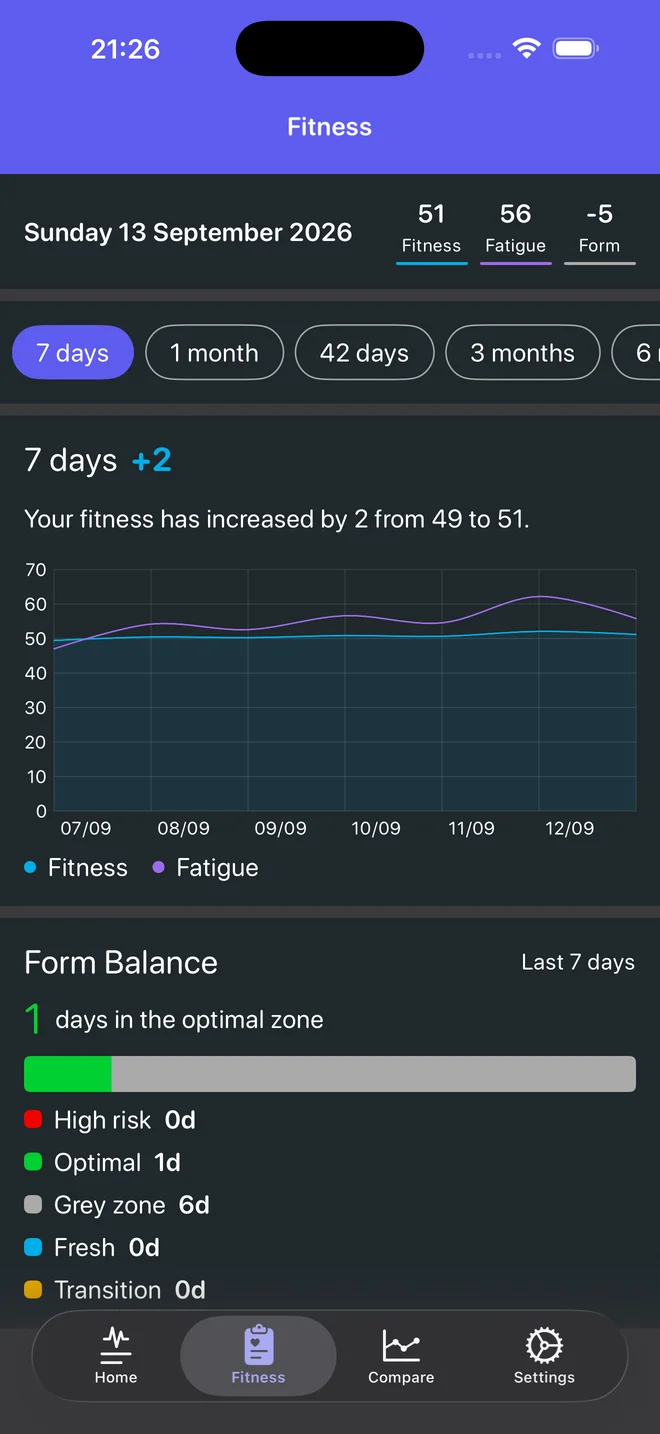
Fitness and fatigue curves across the window you choose, from 7 days upwards, with form balance showing how many days you spent in each training state.

Fitness screen with fitness and fatigue chart and form balance

Activity

Every ride, in context.

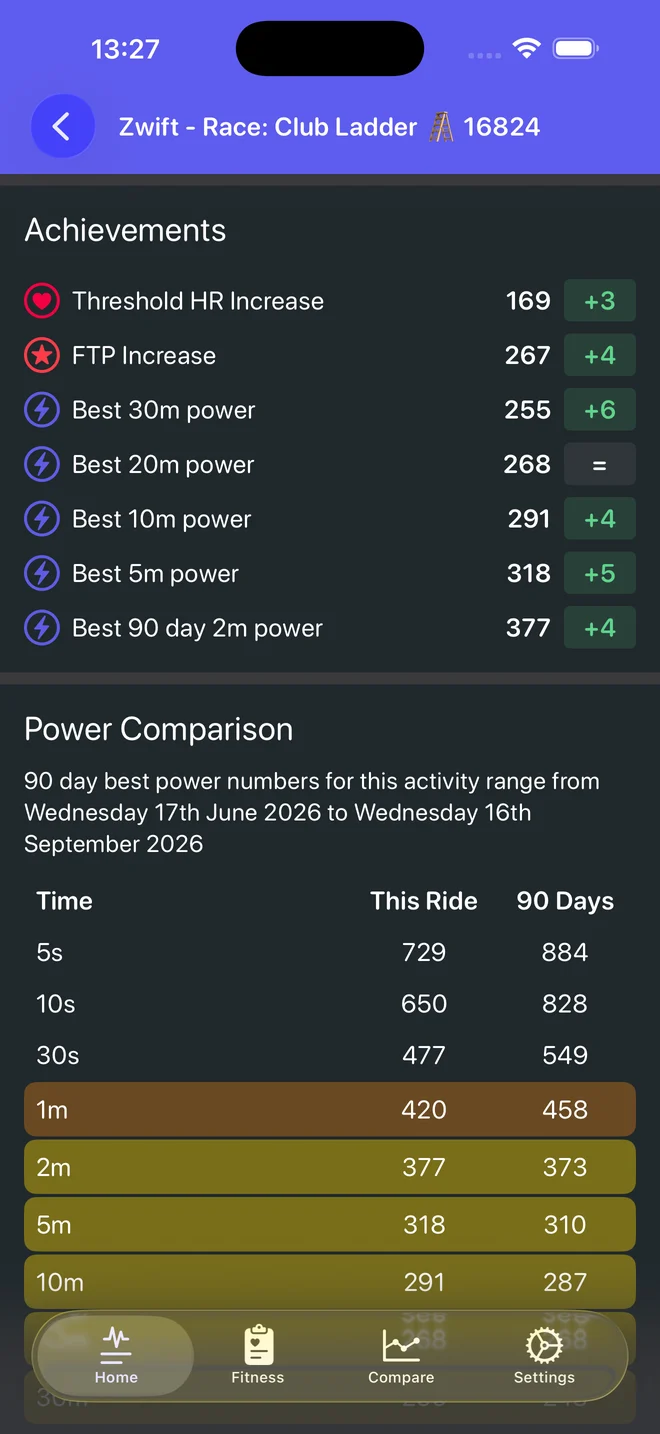
Route, headline metrics, and how the ride moved your fitness, fatigue and form. Then the power breakdown, with time in each zone and your best efforts at every duration set against your best of the last 90 days, the last year or all time. Efforts that match or beat a record are highlighted.

Race achievements and power comparison with records highlighted

Compare

Build your own comparisons.

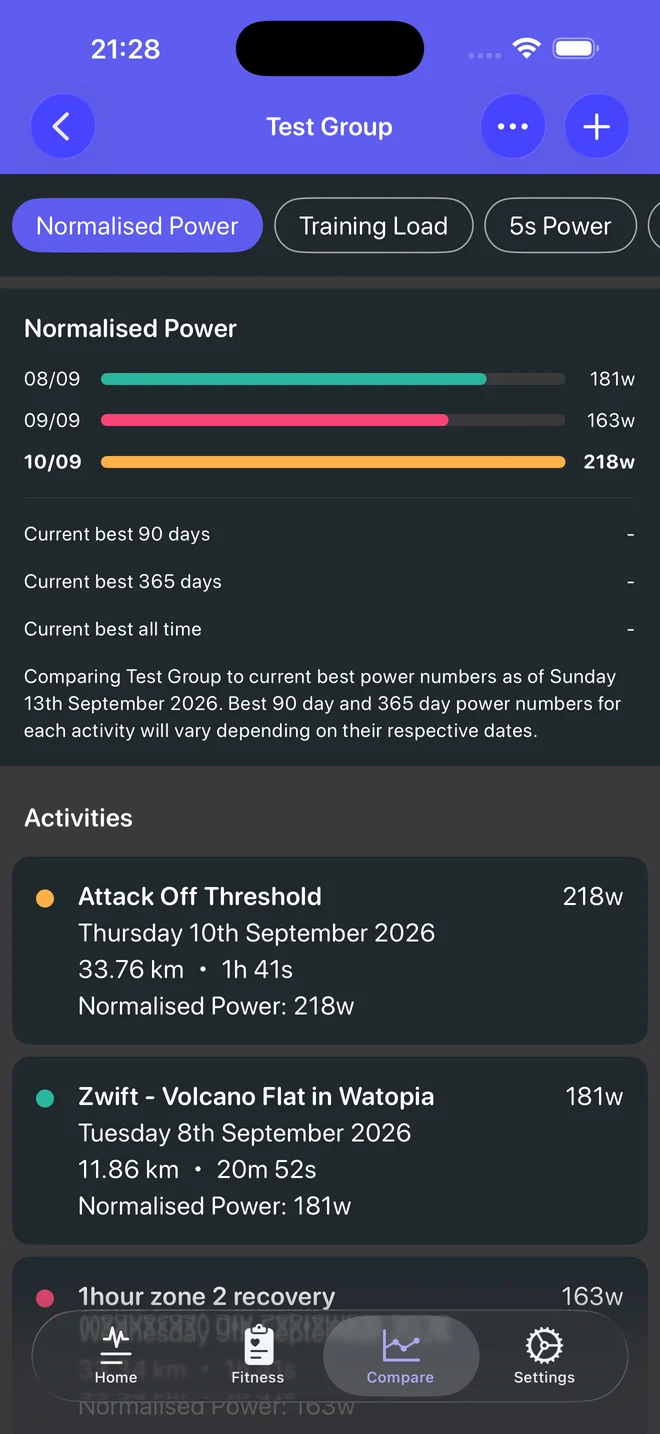
Group any set of activities and compare them by the metric you choose, such as 5 minute power or normalised power. Each ride is measured against the others and against your current best. Make as many groups as you like, for races, routes or workouts.

Comparison group ranking rides by normalised power

Try Soona while it’s in beta.